Using the Performance Monitor
Gaffer contains a built-in performance monitor, which can help diagnose and optimize a node graph’s performance. With the monitor active, performance statistics will be sent to the standard output (stdout) during dispatched renders.
Note
Performance statistics using the performance monitor cannot be generated for IPR rendering.
To turn on the performance monitor:
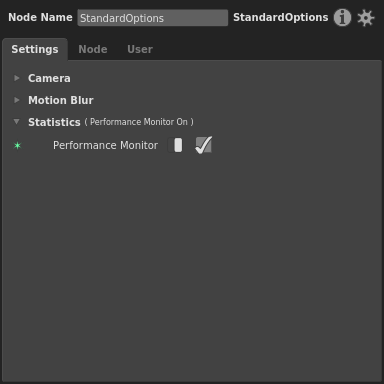
Create a StandardOptions node.
In the Graph Editor, connect the StandardOptions node just prior to your script’s render task node.
In the Node Editor, with the StandardOptions node still selected, navigate to Statistics > Settings.
Toggle the Performance Monitor plug’s switch, and then check its box.
When you dispatch your script to the renderer, performance data will output to the stdout in your terminal. If you are dispatching to a render farm, the farm will receive the stdout.
As an alternative, the stats app allows the same monitoring to be performed from the command line, without the need to dispatch the script.